Calculate the Exponential Growth or Exponential Decay.
Exponential Growth/Decay Calculator
Result:
| Initial Value (A0): | 0 |
| Rate of change: | 0 |
| Time period: | 0 |
| Final Value (At = A0ekt): | 0 |
What is an Exponential Growth?
Exponential growth is defined as the process which changes in quantity over time. This process occurs when the instantaneous rate of change of a particular quantity is proportional to the quantity. This can be described in the form of a function. Such a function is an exponential function of time, that is, the variable which denotes the time is the exponent.
The exponential function denotes the change in quantity: this change may be increasing or decreasing, and it depends on the constant of proportionality. If this constant is a positive number, then exponential growth occurs, and there is an increase in the quantity. If it is negative, then exponential decay is said to take place, and the final quantity is lesser than the initial quantity.
The exponential growth formula is, $$ x(t) = x(0)({1+{r\over100}})^t = x(0)b^t = x(0)e^{kt} $$
where,
In this function, the time t is an exponent.
Properties of Exponential Growth
The following properties are associated with the exponential growth.
Initial value – Denoted by x(0), this is the value at the beginning of the exponential growth (or decay) process.
Rate of change – Denoted by r, this denotes the rate of growth or decay. This number is always used as a percentage.
Growth factor – The growth factor ‘b’ is related to the rate of change as, b = 1+r, and it is restricted to be positive. The exponential function represents decay if 0 < b < 1 and x(0) is positive.
Continuous growth rate – This is denoted by k. If k>0, the function denotes growth, and if k<0, then it denotes decay.
Exponential Growth Formula
The formulas for exponential growth or decay are as follows.$$ x(t) = x(0)({1+{r\over100}})^t = x(0)b^t = x(0)e^{kt} $$
The symbols have their usual meanings.
In the above formulas, the rate of change ‘r’, continuous growth rate ‘k’ and growth factor ‘b’ are related as follows: $$ {1+{r\over100}} = b = e^k $$
Here, e denotes Euler’s number. $$ r = 100({{e^k}-1}), and \; k = ln (1+{r\over100}) $$
Calculating the exponential growth
Consider the following problem describing exponential growth.
The population of a village at the beginning of 2015 was 10,000 people. It was observed that the population of the village grows at a steady rate of 4% annually. What is the projected population of the town in the year 2022?
The above problem is an instance of exponential growth. Here, the initial population x(0) = 10,000, rate of change r = 4%, and t denotes the number of years that have passed since 2015. In this case, for the year 2025, we use t = 7 because this is the difference in the number of years between 2015 and 2022. Plugging these values into the formula gives us the following.
$$ x(t) = x(0){(1+{r\over100})^7} $$
$$ x(t) = 10000 * {(1+{4\over1000})^7} = 10000*{1.04^7} = 13159.31 ≈ 13,159 $$
So, the projected population of this village in the year 2022 is approximately 13,159 people.
To understand this problem, one could compute the population every year till the year 2022. These values have been rounded off to the nearest integer and tabulated below.
| year | t | x(t) |
|---|---|---|
| 2015 | 0 | 10000 |
| 2016 | 1 | 10400 |
| 2017 | 2 | 10816 |
| 2018 | 3 | 11249 |
| 2019 | 4 | 11699 |
| 2020 | 5 | 12167 |
| 2021 | 6 | 12653 |
| 2022 | 7 | 13159 |
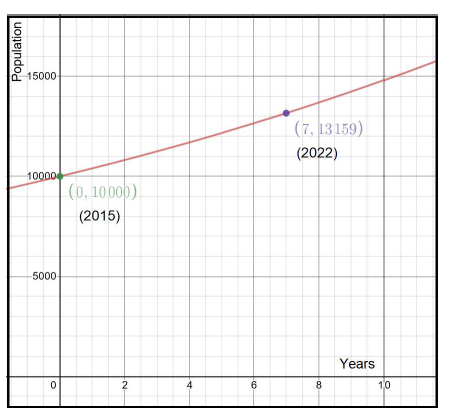
To get a better understanding of the growth, this function can be graphed with the number of years on the x-axis, and the population on the y-axis. The data from the table are points on this continuous graph of the exponential growth function,
$$ 𝑥(𝑡) = 10,000 * {(1.04)^t} $$
The base of the exponential function is 1.05, which is greater than 1, so the graph obtained is increasing. The point (0,10000) indicates the initial value in the year 2015, and (7, 13159) indicates the final value in the year 2022. Each point on the x-axis indicates the number of years after 2015.
Areas of application
Exponential growth and decay have numerous applications in daily life.